LTOT 2012
Data from the 2012 annual report show that there is a slow but steady increase of the number of patients on LTOT for chronic hypoxaemic respiratory failure. The prevalence is 28 patients per 100,000 inhabitants, and the annual number of new prescriptions is 12.5 per 100,000.
Average PaO2 at therapy start is 48 mm Hg with no difference between hospitals and no change during the existence of the register. Only three percent of the patients were reported to have PaO2 above 60 mm Hg. Mean PaCO2 for the COPD patients was 47 mm Hg, their mean FEV1 was 0,86 and mean BMI was 24.
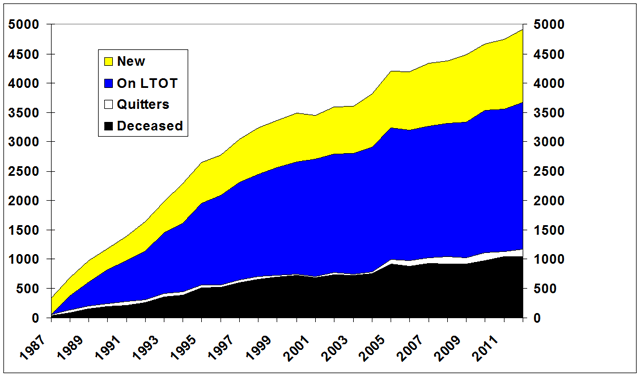
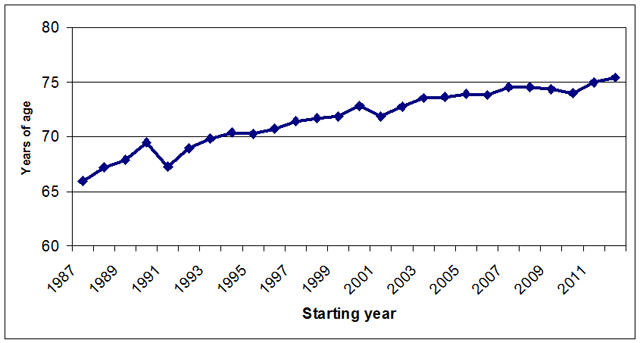
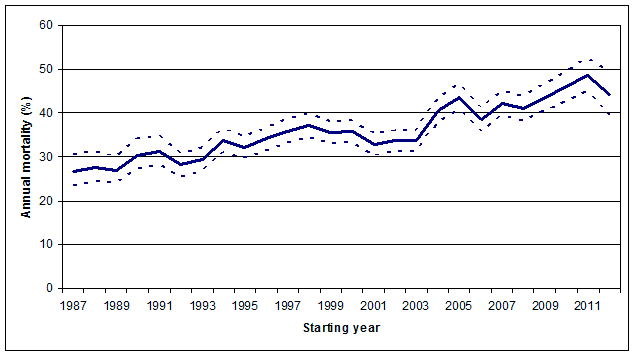
Unadjusted annual mortality rate has increased from 25% (1987) to 45% and mean age has increased from 66 to 75 years. During the same period, life expectancy for a 65 year old individual has increased 3-4 years. Our interpretation of these data is that the patients nowadays are given LTOT at a later stage in their life. The alternative way of describing this is that we manage to keep then oxygen-free during a longer period of their disease.
We observe a strong gender shift from a male (57% 1987) to a female (59% 2012) dominance. This is well in accordance with smoking habits in our country.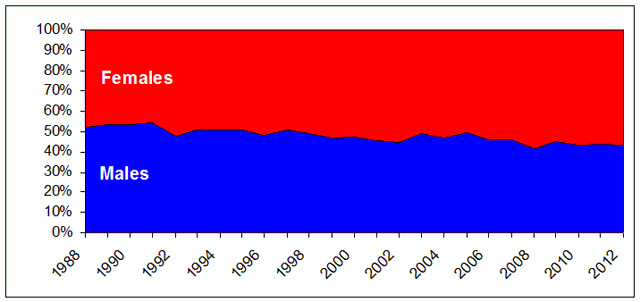
As expected, airway and parenchymal lung diseases are the most common diagnoses among patients on LTOT.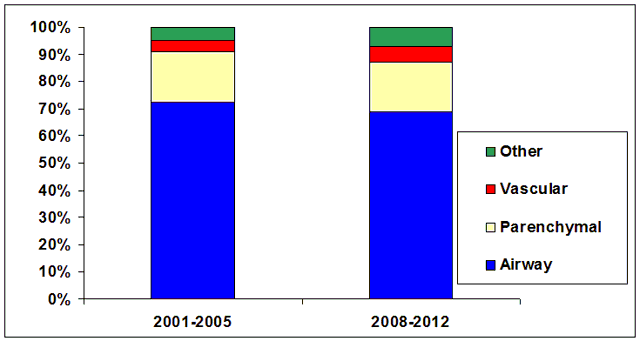
LTMV 2012
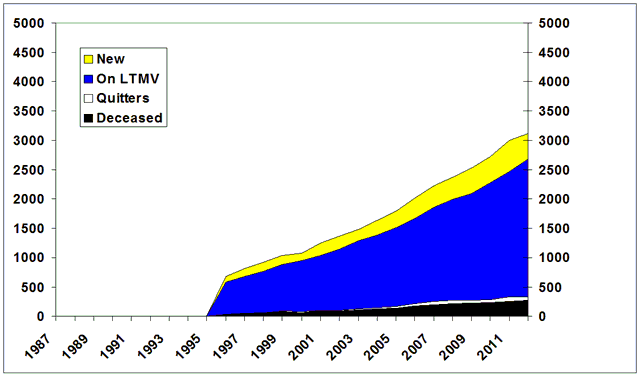
Sweden has approximately 25 patients with LTMV per 100,000 inhabitants, which can be compared to 28 for LTOT. The figure shows that the number is rising and that it patients rarely stop LTMV from other causes than death. The effects of treatment can be described as improvement of blood gases, where the patients typically increase their PaO2 and decrease their PaCO2 with 7-9 mm Hg. Quality of life is probably more important to the patients. We therefore ask them five standard questions on sleep and wakefulness. The data convincingly show a strong improvement with therapy. This is probably one of the factors behind the strong patient compliance with therapy. Life expectancy is typically eight years for our patients (non-ALS).
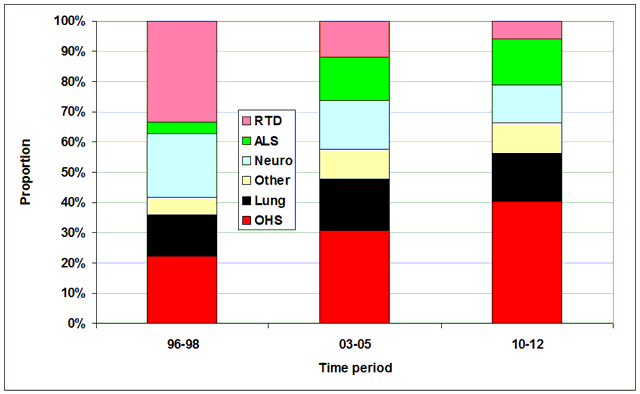
We have observed a strong shift in the spectrum of diagnoses among our patients with LTMV. During late 90s, it was dominated by patients with restrictive thoracic disease, whereas patients with obesity hypoventilation now constitute 40%. Sweden has a much lower fraction of patients with COPD than most other countries.
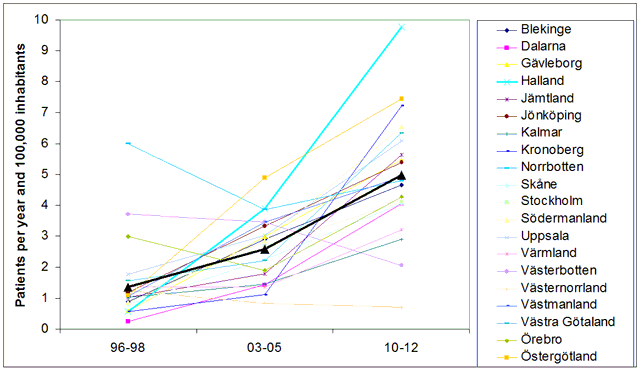
Prescription habits (availability) still differs remarkably between different regions (counties) within our country. The previously noted tendency towards an equalization has stopped. These differences do not correspond to major differences in indications (such as blood gas data or spirometry) or in the spectrum of patients. We do not know if the differences are due to substantial differences in health care resources, or to the attitude of the caregivers.
CPAP 2012
The CPAP-register started in July 2010 and now covers almost 10,000 new patients each year, mainly from lung clinics and ENT clinics. Prescription rates vary widely between 80 and 200 per 100,000 inhabitants without any substantial difference in patient characteristics. Their mean age is 57 years, BMI 32.2, AHI 35.5, ODI 33.2 and ESS 10.5.
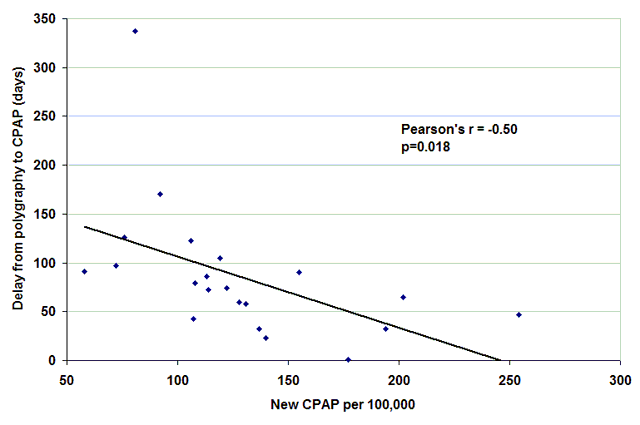
Waiting lists are long, median waiting time from referral to diagnostic polygraphy is 75 days and the subsequent waiting time to CPAP is 61 days. There is a strong negative relationship between waiting time to CPAP and prescription rate. Counties/hospitals with short waiting lists also have the highest prescription rates.
